
Transportation in Transition
A Look at Changing Travel Patterns in America’s Biggest Cities
A first-of-its-kind report showing that on average, residents of America’s cities are driving less and using other modes of travel more. The report compares the latest government data on changes in automobile use, public transit travel and biking in each of the most populous 100 urbanized areas across the nation. Recommendations are made for how policy leaders should adapt to these new trends.
Downloads
Americans’ transportation habits have changed. The average American drives 7.6 percent fewer miles today than when per-capita driving peaked in 2004. A review of data from the Federal Highway Administration, Federal Transit Administration and Census Bureau for America’s 100 most populous urbanized areas – which are home to over half of the nation’s population – shows that the decline in per-capita driving has taken place in a wide variety of regions. From 2006 to 2011, the average number of miles driven per resident fell in almost three-quarters of America’s largest urbanized areas for which up-to-date and accurate data are available. Most urbanized areas have also seen increases in public transit use and bicycle commuting and decreases in the share of households owning a car.
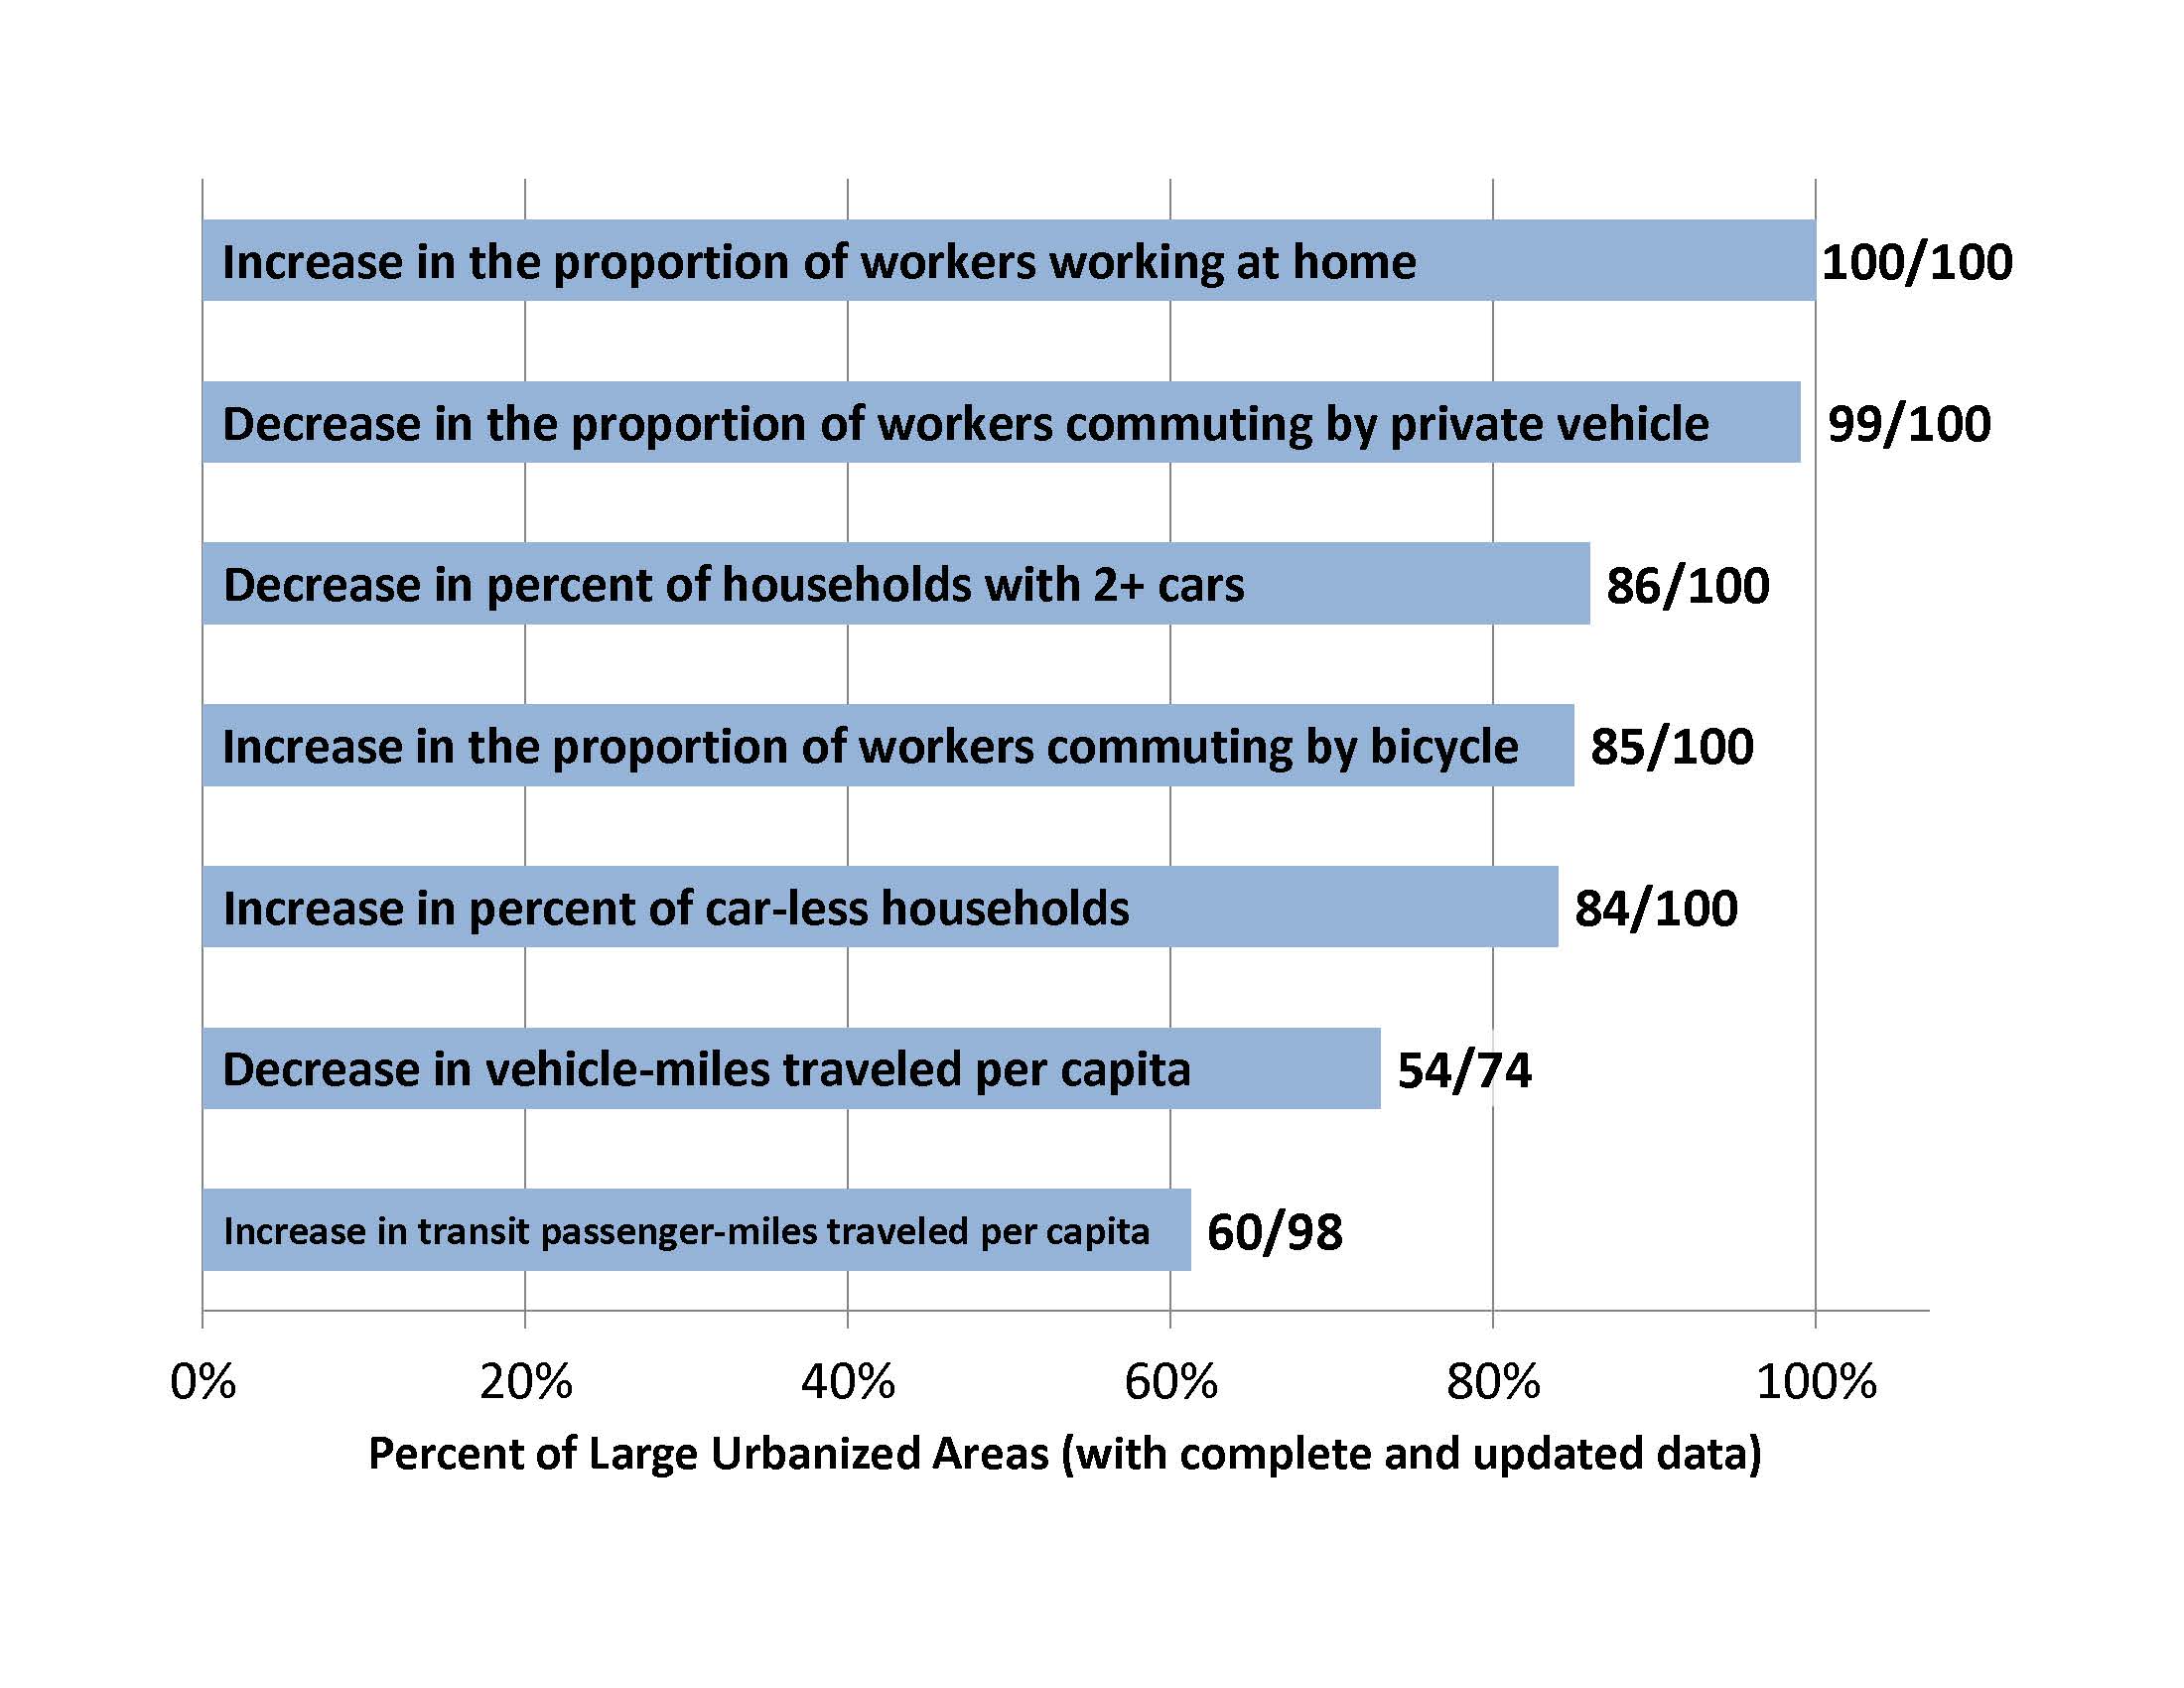
NOTE: The first five data bars (“Increase in the proportion of workers working at home” to “Increase in the percent of car-less households”) measure the 100 most populous urbanized areas from 2000 to 2010. The “Decrease in vehicle-miles traveled per capita” measures the 74 (out of the 100) most populous urbanized areas for which comparable data exist from 2006 to 2011. The “Increase in transit passenger-miles traveled per capita” measures the 98 (out of 100) most populous urbanized areas for which comparable data exist from 2005 to 2010.
Regional, state and federal officials need to account for changing trends in driving as they consider how to adapt their transportation policies and infrastructure plans to a new future of slower growth in vehicle travel.
Transportation trends are changing in America’s biggest urbanized areas.
- The proportion of workers commuting by private vehicle – either alone or in a carpool – declined in 99 out of 100 of America’s largest urbanized areas between 2000 and 2007-2011.[i]
- The proportion of residents working from home has increased in 100 out of the 100 largest urbanized areas since 2000.
- The proportion of households without cars increased in 84 out of the 100 largest urbanized areas from 2006 to 2011.
- The proportion of households with two cars or more decreased in 86 out of the 100 largest urbanized areas from 2006 to 2011.
There is additional evidence of declining driving in those urbanized areas with standardized data on vehicle-miles traveled.
- The average number of vehicle-miles traveled (VMT) per capita declined in 54 out of the 74 large urbanized areas whose trends could be analyzed between 2006 and 2011.[ii]
- New Orleans has seen the largest drop in per-capita VMT – 22 percent – since 2006, possibly a result of Hurricane Katrina. The urbanized areas containing two Wisconsin cities, Milwaukee and Madison, saw the second and third biggest drops in per-capita VMT – 21 percent and 18 percent, respectively. Two Pennsylvania urbanized areas, Harrisburg and Pittsburgh, saw the fourth and fifth biggest drops in per-capita VMT – 14 percent and 13 percent, respectively.
The use of non-driving modes of transportation has increased in a majority of the nation’s most populous urbanized areas.
- The proportion of residents bicycling to work increased in 85 out of 100 of America’s largest urbanized areas between 2000 and 2007-2011.
- The number of passenger-miles traveled (PMT) per capita on transit increased in 60 out of 98 of America’s large urbanized areas whose trends could be analyzed between 2005 and 2010.[iii]
Variations in the economy do not appear to be responsible for variations in the trends in driving among urbanized areas. In fact, the economies of urbanized areas with large declines in driving have been less affected by the recession according to unemployment and poverty indicators.
- Between 2006 and 2011, the average increase in the unemployment rate in the 15 urbanized areas with the highest per-capita declines in VMT was 3.9 percent, while the average increase in all other urbanized areas was 4.6 percent.
- Between 2006 and 2011, the average increase in the poverty rate of the 15 urbanized areas with the highest per-capita declines in VMT was 2.7 percent, while the average increase in all other urbanized areas was 3.6 percent.
The time has come for cities and states to shift their transportation priorities away from investments in expensive, unnecessary new highways, and toward the maintenance and repair of our existing infrastructure and the development of new transportation choices for Americans.
To that end, public officials should:
- Revisit transportation plans. Many existing transportation plans continue to reflect outdated assumptions that the number of miles driven will continue to rise steadily over time. Officials at all levels should revisit transportation plans to ensure that they reflect recent declines in driving and new understandings of the future demand for travel.
- Reallocate resources. With driving stagnating in many areas and demand for transit, bicycling and pedestrian infrastructure increasing, officials should reallocate resources away from wasteful highway expansion projects and toward system repair and programs that expand the range of transportation options available to Americans.
- Remove barriers to non-driving transportation options. In many areas, planning and zoning laws and transportation funding rules limit public officials’ ability to expand access to transportation choices. Officials at all levels should remove these barriers and ensure access to funding for non-driving forms of transportation.
- Use innovative travel tools and services. New technologies and techniques provide transportation officials with new tools to address transportation challenges. Transportation agencies should encourage the use of carsharing, bikesharing and ridesharing and provide real-time travel information for public transit via smartphone.
- Get better data. Transportation agencies should compile and make available to the public more comprehensive, comparable and timely data to allow for better informed analysis of the causes and magnitude of changes in driving trends. Officials at all levels should eliminate inconsistencies in the reporting of transportation data, increase the frequency of surveys that shed light on changes in transportation preferences and behaviors, and use emerging new sources of information made possible by new technologies in order to gain a better grasp of how driving trends are changing and why.
[i] For a list of data sources, see the Methodology. Throughout this report, “2007-2011” refers to data collected by the 2011 American Community Survey 5-year survey which covers years 2007, 2008, 2009, 2010 and 2011. The American Community Survey reports one number for all five years.
[ii] While this report focuses on the transportation trends in America’s 100 most populous urbanized areas, 26 urbanized areas are excluded from the VMT analysis. VMT per capita and changes in VMT over time in these 26 urbanized areas could not be accurately determined due to states’ failure to use standardized and up-to-date data collection methods.
[iii] While this report focuses on the transportation trends in America’s 100 most populous urbanized areas, two urbanized areas were excluded from the public transit analysis. The passenger-miles traveled on public transit in Mission Viejo (CA) and Ogden-Layton (UT) were excluded because no transit agency lists these two urbanized areas as their primary urbanized area, and the passenger miles and trips traveled within urbanized areas in 2005 were derived from transit agency travel information.